
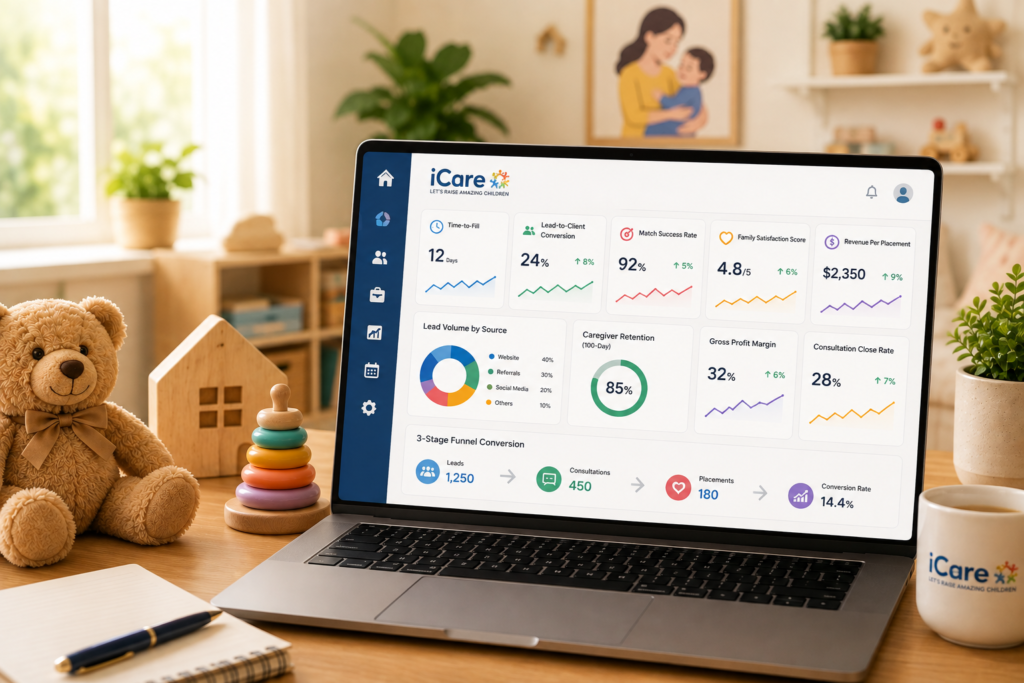
The 15 Essential Nanny Agency KPIs You Actually Need on Your Dashboard
The U.S. maids, nannies, and gardeners market just hit $30.9 billion, but is your agency actually capturing its fair share of that massive growth?
Most directors launch their agencies because they have a phenomenal instinct for matching exceptional caregivers with overwhelmed families.
As your client list grows, running a business on instinct alone will eventually cap your
revenue. You cannot fix leaks in your sales funnel or spot dipping repeat booking rates if you do not even know they
exist.
You need a reliable early warning system. Upgrading your tech stack with daycare management software is the first step toward getting your operational data out of your head and onto a clear
dashboard.
If you are ready to transition from being a busy matchmaker to a truly data-driven childcare center owner or a director, this guide is for you. In this guide, we will walk you through the exact performance indicators you need to track across quality of care, staffing, marketing, and finances.
Let’s get started.
Key Takeaways
- Data Drives Revenue: Care agencies that measure their sales funnel accurately generate more
than double the revenue of those that fly blind. - Protect Your Reputation: Your match success rates and family satisfaction scores are the
leading indicators of your financial future. - Speed is a Feature: Tracking exactly how long it takes to place a nanny helps you find
bottlenecks and keep families from choosing a competitor. - Source Quality Matters: Not all applicants are created equal. Tracking candidate sources
prevents you from spending money on job boards that only produce high-turnover hires. - Profit Over Top-Line Growth: Hitting record revenue means nothing if your direct costs are
eating away your entire profit margin. - Ditch the Spreadsheets: Moving your data into a unified platform gives you real-time
visibility without the manual data entry headache.
Why does measurement separate agencies that scale from agencies that stall?
The demand for your services is practically built into the modern economy. According to labor data cited by
Verified Market Reports, 62% of married-couple families with children under 18 had both parents employed in 2023.
Now this means that families desperately need reliable care.
And they are actively searching for it. Therefore, capturing that demand requires complete visibility into your own
operations.
Now the question is: How do you measure a nanny agency’s success?
Well, according to our experts at iCare, you start by looking at the hard numbers instead of relying on gut
feelings. A recent benchmark report from Activated Insights revealed a staggering reality. Care agencies that track every single client inquiry report a median revenue of $3.15 million. Agencies that fail to track inquiries report
just $1.40 million.
That is a multi-million dollar gap. Tracking your data literally compounds into revenue. Ignoring it compounds into
lost opportunities. When you finally learn how to track nanny agency performance, you stop wondering where your next
placement is coming from. You know exactly which levers to pull to generate growth.
Implementing a dedicated KPIs page and reporting dashboard removes this guesswork completely. It gives your
entire team a clear line of sight into what is working and what is broken.
Quality of ChildCare Metrics
Your reputation is the engine of your business. If parents lose trust in your placements, marketing spend cannot
save revenue.
Focus on these essential childcare staffing agency KPIs to ensure your standards stay high as you add more
families:
- Family satisfaction score: Survey families immediately after placement and quarterly thereafter. Use a simple 1 to 10 scale. A score dropping from 9 to 7 flags a communication gap between the
caregiver and the parents long before it becomes an emergency. - Repeat booking rate: Essential for agencies offering backup, temporary, or date-night care alongside long-term placements. When families return repeatedly for supplemental care, your agency remains
top-of-mind. - Nanny agency client retention rate: Track how many families stay with your agency for 6 to 12 months. According to McKnight’s Home Care, client turnover dropped to 45.5% in 2024, representing a seven-year
low. The report credited proactive communication as the primary driver of retention. - Complaints and match success rate: Measure the percentage of matches that complete their
contract without requiring reassignment. One recurring complaint about caregiver punctuality usually indicates a
flaw in your candidate orientation rather than an issue with a single nanny.
These are the primary KPIs every nanny agency should track to protect their client relationships.
Quality of Care Metrics in Action
| Metric | What It Measures | Operational Scenario |
|---|---|---|
| Family Satisfaction | Client sentiment and communication health | A parent gives a 6/10 because daily updates are inconsistent. You introduce a structured digital log, fixing the problem immediately. |
| Repeat Booking Rate | Trust and utility for short-term care | A family uses your weekend backup service three times in two months, showing high trust in your roster. |
| Client Retention | Long-term agency loyalty | An annual placement renews for a second year because your team conducted regular check-ins. |
| Match Success Rate | Quality of candidate vetting and family intake | A family requests a quiet, infant-focused nanny. You place a high-energy toddler specialist. The match fails in week two, revealing an intake mismatch. |
Staffing Metrics
You cannot deliver care without qualified, reliable caregivers. Your candidate roster is your active inventory, and
it requires careful oversight.
- Nanny agency time-to-fill metric: Measures the days between a signed family agreement and the
caregiver’s first day. Placement guidelines from Choice Parenting and Nounou Nanny show that typical family
searches run between 2 and 8 weeks. If your timeline stretches beyond 8 weeks, you will see candidates lose
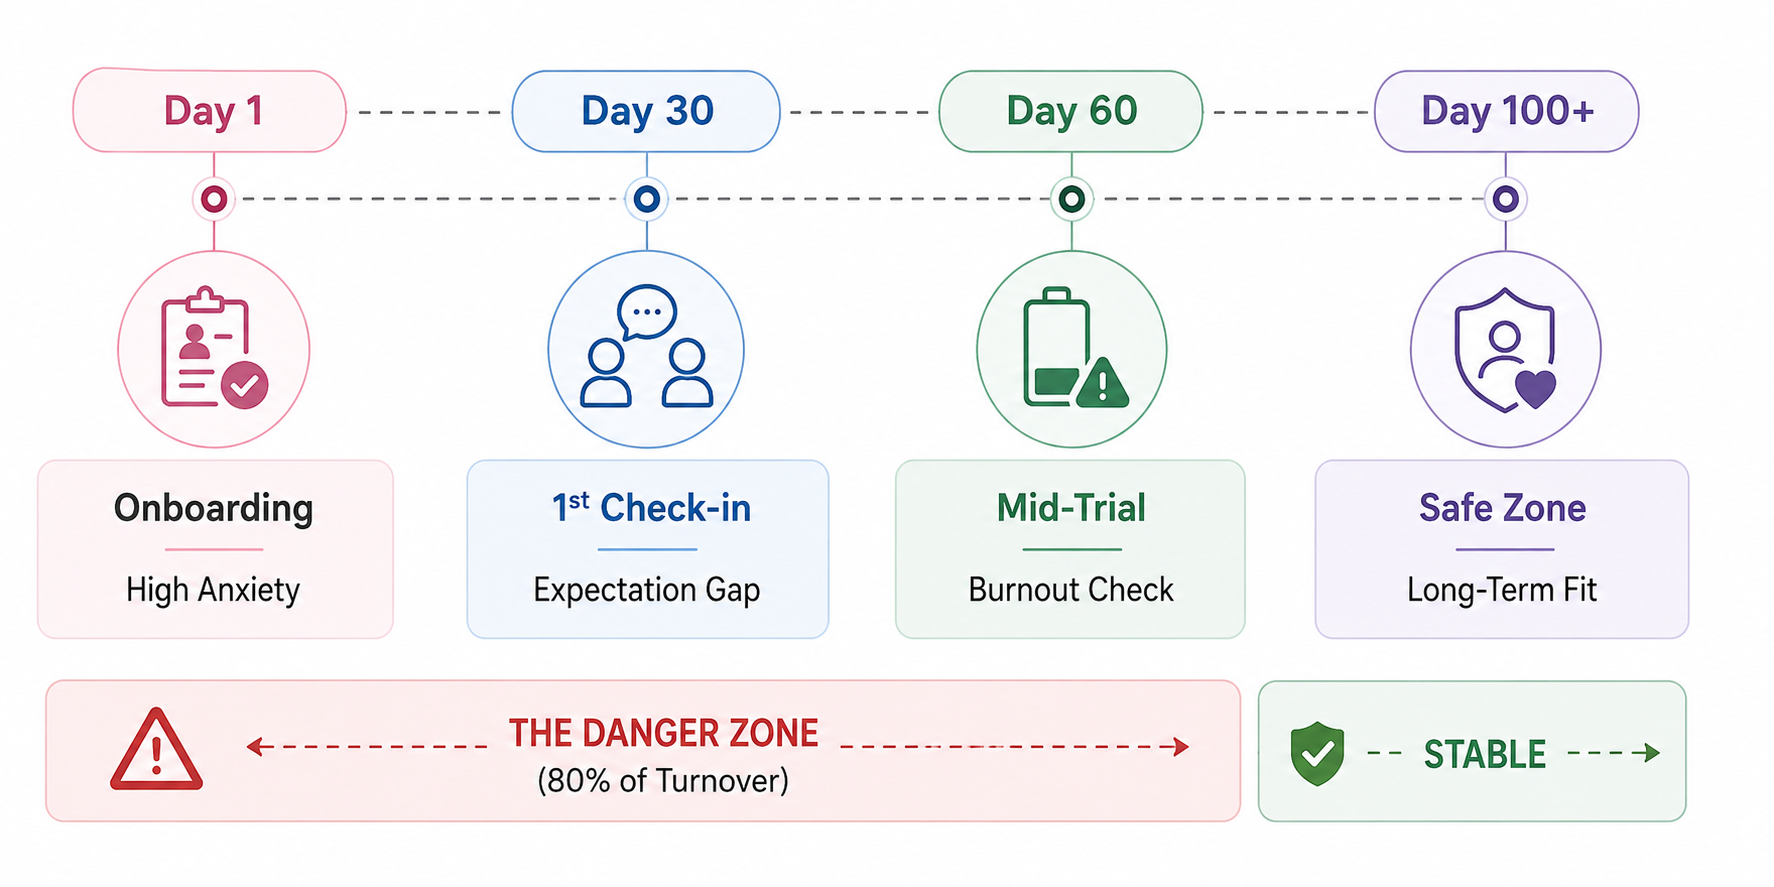
interest and parents look elsewhere. - Caregiver retention rate: Research from Home Health Care News shows caregiver turnover in
home-based care will reach 75% in 2024. Even more pressing, a study by Ok Alone found that nearly 4 in 5
caregivers left within their first 100 days. Keeping a caregiver past the three-month mark dramatically lowers
replacement costs. - Cost per hire: Calculate the total recruitment spend, background checks, and staff hours
required to onboard a caregiver. An analysis by Activated Insights on recruitment sources revealed that
Indeed-sourced candidates had an 88% turnover rate, while referral-based candidates stayed significantly longer.
Recruiting dollars should be redirected into referral programs to reduce caregiver turnover.
Note: If you’re looking for proven strategies for retaining elite talent, review the iCare Staff Satisfaction and Retention guide.
Staffing Performance Indicators
| Metric | What It Measures | Operational Scenario |
|---|---|---|
| Time-to-Fill | Intake-to-placement pipeline speed | Your background checks take three weeks to clear. Streamlining this step cuts your placement timeline from seven weeks to four. |
| 100-Day Retention | Early candidate onboarding success | A nanny struggles with house rules in month one. Your 30-day coordinator check-in resolves the issue, preventing early resignation. |
| Recruiting Source Cost | Return on candidate acquisition channels | You spend $1,500 on broad job boards with high turnover. You pivot that budget to local university career boards, sourcing higher-retaining candidates for half the cost. |
| Applicant-to-Hire Ratio | Selectivity and top-of-funnel precision | Out of 50 applicants, you accept 3 into your network, proving your rigorous screening standards to prospective parents. |
Sales and Marketing Metrics
Getting families to call your office is only half the battle. If parents reach out to your agency and disappear without booking care, pouring more money into advertising will not fix the problem.
You need to know why they walked away, which marketing channels brought them to you in the first place, and how much it actually costs to win their business.
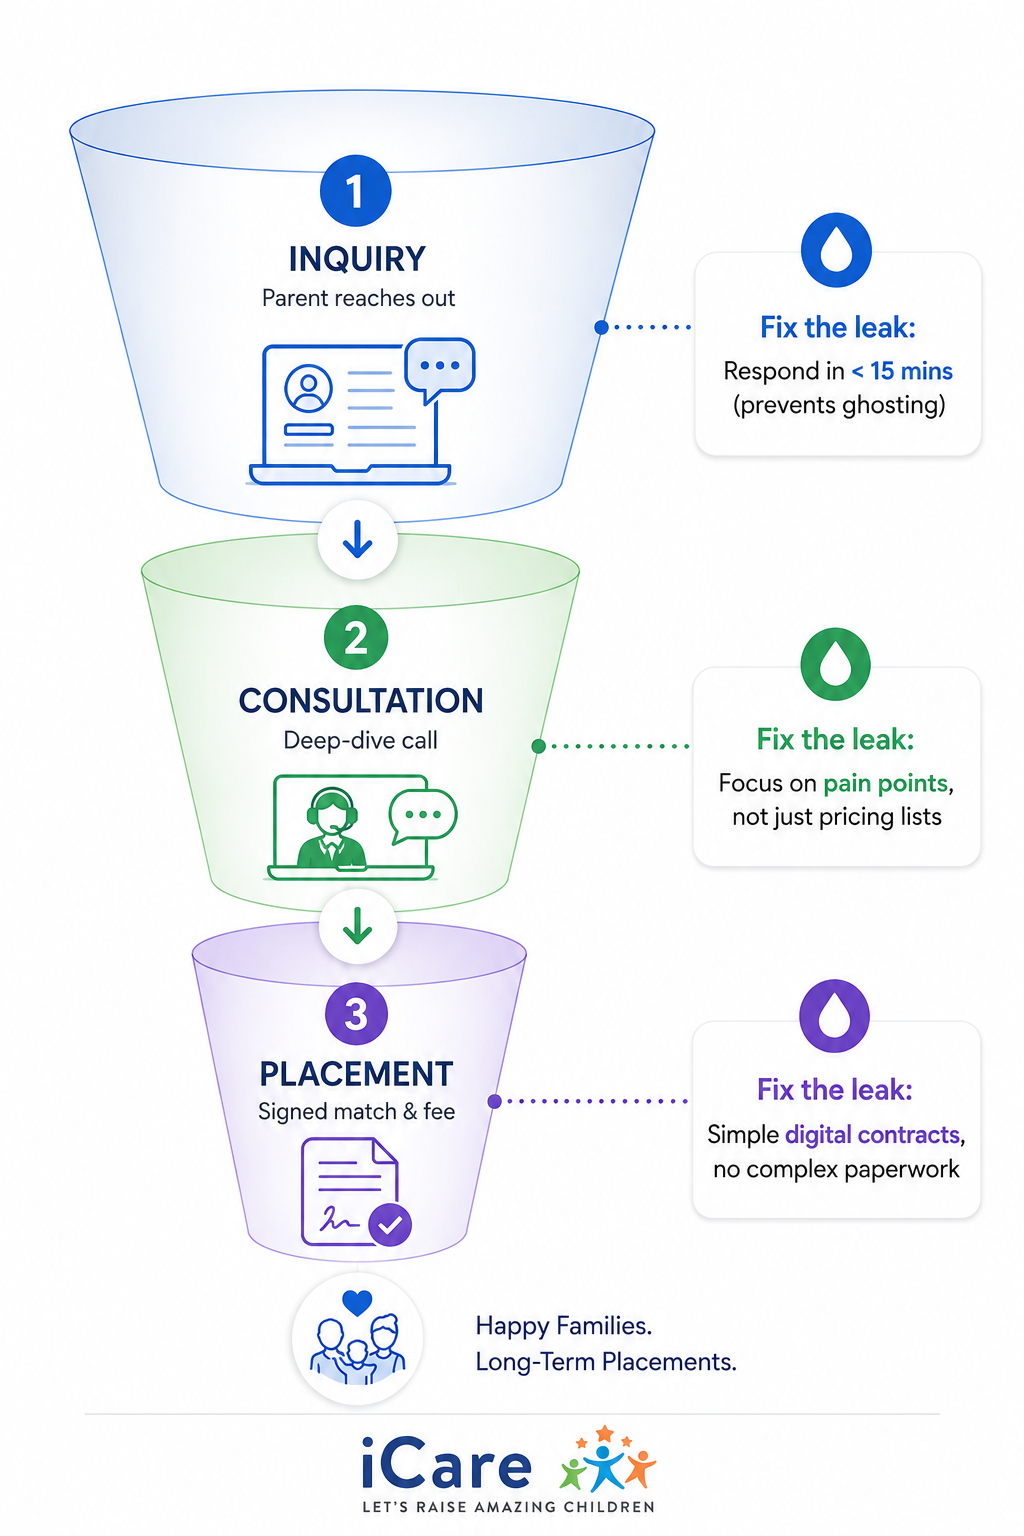
Here are the sales and marketing numbers you need to watch:
- Lead-to-Client Conversion Rate: If 100 families reach out to you this month and 20 of them end
up hiring a nanny through your agency, your nanny agency lead conversion rate is 20%. Real growth is not just
about getting the phone to ring more often. It is about understanding why those other 80 families walked away so
you can fix the gaps in your intake process. - Lead Source Tracking: Saying your clients come from “word of mouth” is too vague to be useful.
You need to know the exact source. Did a local pediatrician recommend you, or did a parent find you through a
local Google search? When you know which specific channels bring in your ideal families, you can focus your time
there and stop spending money on channels that deliver zero results. - The Three-Step Funnel: Every client moves through three simple stages: Inquiry, Consultation, and Placement. Tracking each step shows you where people lose interest. If 50 families call you, but only 5 agree
to a consultation, your introductory phone conversation needs work. A pricing or agreement process that prevents 50 families from signing a contract may be hampering the process. - Client Acquisition Cost by Channel: Nanny agency placement fees are expensive. According to data from UrbanSitter, agency fees typically run between 10% and 20% of a nanny’s annual salary, which often land
between $800 and $10,000 per placement. Now, because each match is worth thousands of dollars, losing a lead due to a forgotten follow-up email is a massive financial loss. You need to track exactly how much time and ad spend
it takes to win one paying client from each marketing source.
Please Note: To see how automated workflows can help your team follow up instantly and stop valuable leads from slipping away, visit the iCare Lead Generation and Nurturing page.
Financial Metrics
Revenue provides top-line momentum, but profit keeps your doors open. Protect your nanny agency’s profitability by
tracking your underlying costs.
- 12-month trailing revenue (TTM): Monthly revenue fluctuates heavily between back-to-school surges and summer slowdowns. TTM averages the prior 12 months continuously, showing whether your agency is
expanding or contracting. - Gross profit margin: Subtract direct placement costs (background checks, drug screenings, insurance, onboarding staff hours) from your placement fee, then divide by the fee. Healthy gross margins provide
the cash flow required to scale. - Revenue per placement: Track the total revenue generated per client over their lifetime,
including initial retainers, placement fees, and recurring payroll management fees. - Business profit: The bottom line after subtracting all operating expenses, including team salaries, rent, and specialized daycare software licenses.
Financial Health Check
| Metric | What It Measures | Operational Scenario |
|---|---|---|
| TTM Revenue | Real year-over-year growth trajectory | Summer revenue dips by 20%, but your 12-month trailing total shows a steady 15% climb year-over-year. |
| Gross Profit Margin | Direct placement profitability | Background check fees increase. By updating your client pricing, you maintain a strong 65% gross margin. |
| Revenue Per Placement | Lifetime client value | You introduce an ongoing backup care subscription, adding recurring monthly revenue to every permanent placement. |
| Operating Profit | True bottom-line sustainability | You review software subscriptions and administrative overhead, reducing operating costs by 8% without impacting service quality. |
What to Actually Do With This List
Attempting to track sixteen performance metrics on day one leads to dashboard burnout. Successful scaling of a
nanny agency requires focus.
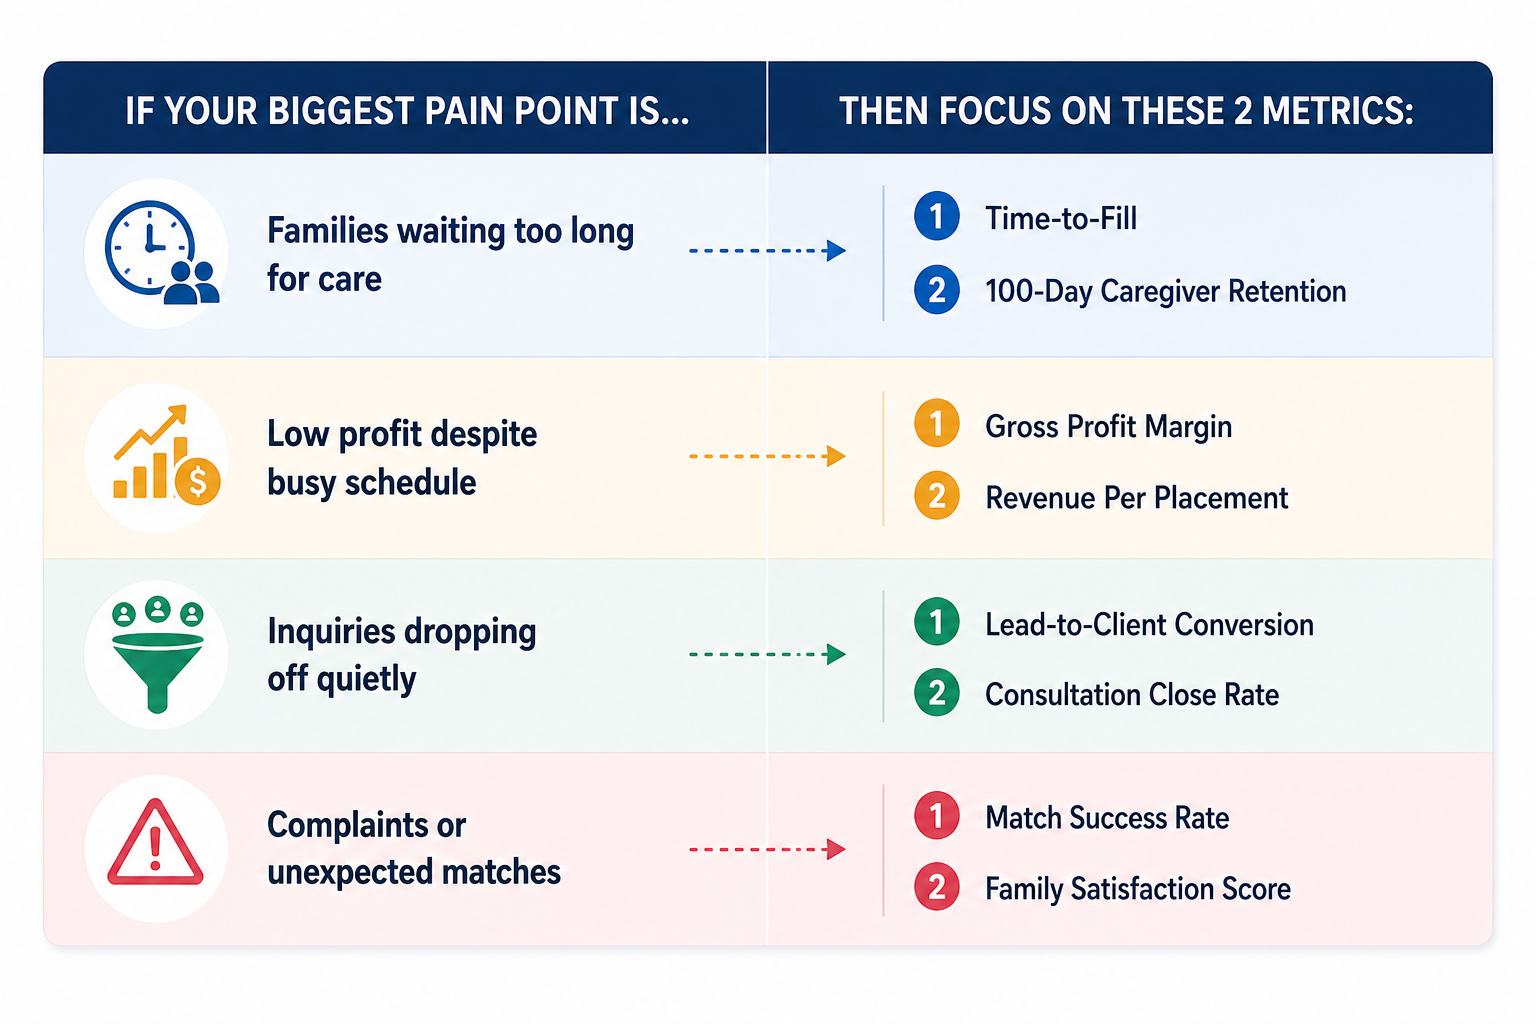
Start with one primary metric per category based on your immediate operational challenge:
- If matching is unstable: Focus on Match Success Rate and Family Satisfaction.
- If candidate supply is low: Focus on Time-to-Fill and 100-Day Caregiver Retention.
- If revenue is stalling: Focus on Lead-to-Client Conversion and Lead Source CAC.
- If cash flow is tight: Focus on Gross Margin and Lifetime Revenue Per Placement.
Review these metrics monthly with your placement coordinators and intake specialists. Involve the team in identifying why numbers move.
Frequently Asked Questions
What KPIs should a nanny agency track?
A nanny agency should track four main categories: quality of care (family satisfaction, match success rate),
staffing (time-to-fill, caregiver retention), sales and marketing (lead-to-client conversion rate, acquisition
cost), and finances (gross profit margin, trailing 12-month revenue).
How do you measure a nanny agency’s success?
Tracking metrics to measure nanny agency success involves evaluating client retention, caregiver tenure past 100
days, and gross profit margin. High repeat placements combined with stable profit margins indicate a healthy
agency.
What is a good time-to-fill for a nanny placement?
A standard timeline for placing a permanent nanny is 2 to 8 weeks. Specialized roles, like newborn care
specialists or private educators, may take longer depending on local candidate availability.
How much caregiver turnover is normal in childcare staffing?
Annual caregiver turnover in home-based care often reaches 75%, with nearly 80% of departures occurring in the
first 100 days. Agencies that implement structured 30-day onboarding check-ins reduce this turnover substantially.
What is a good lead-to-client conversion rate for a nanny agency?
A healthy inquiry-to-client conversion rate typically ranges between 15% and 25%. High-touch consultation
processes that focus on parent needs yield higher close rates than automated email quotes.
How iCare Supports Nanny Agency KPI Tracking
Managing these metrics across disjointed spreadsheets and paper files wastes valuable hours.
The iCare Nanny Agency platform serves as dedicated nanny agency management software, consolidating your data into
actionable dashboards:
- Quality of Care: The family portal sends daily logs, activity notes, and post-session check-ins
directly to parents, providing continuous satisfaction tracking. - Staffing & Candidate Pipelines: As specialized nanny placement agency software, iCare tracks
candidate progress from interview to trial, automatically calculating time-to-fill and monitoring CPR
certification renewals. - Integrated CRM: The built-in CRM tracks leads across every channel, highlighting conversion
bottlenecks from initial phone call to signed contract. - Unified Billing & Payroll: As comprehensive childcare management software, the system automates
client invoicing and caregiver payroll through geofenced timecards, keeping gross margin calculations precise.
Whether you are evaluating the best childcare management software, exploring best software for nanny agencies, or upgrading your existing systems, iCare delivers the operational clarity needed to scale your business with confidence.
How do nanny agencies calculate profit margin?
To find your gross margin percentage before overhead, subtract all direct expenses (screening, caregiver wages, and job insurance) from your earnings, then divide that figure by total revenue
Ready to move from gut feelings to real-time dashboards? See how iCare consolidates quality of care, staffing, marketing, and financial metrics into one unified platform.